Impressions, Clicks, CTR and Position in GSC - What Each Metric Really Means
Decode impressions, clicks, CTR and position in Google Search Console: precise definitions, interpretation pitfalls and concrete actions to drive your SEO strategy.
Google Search Console Metrics: Impressions, Clicks, CTR and Position Explained
Analysing Google Search Console metrics is the foundation of any data-driven SEO strategy. A precise understanding of impressions, clicks, CTR and average position allows you to move beyond guesswork and take control of your organic visibility. This technical guide explains how to leverage these indicators to measure the real impact of your search engine optimisation efforts.
Understanding Google Search Console: Your Essential SEO Dashboard
Google Search Console (GSC) is the indispensable native tool for monitoring your website’s technical health and organic performance. Unlike traditional audience analytics tools, Search Console measures activity before users land on your site. It captures data directly from search engine results pages (SERPs), providing an unfiltered view of your actual visibility.
As an SEO professional, you should treat GSC as the starting point for any traffic analysis. It quantifies the interaction between search queries and your indexed URLs. The tool delivers raw statistics on how your blue links, rich snippets and local results are displayed.
That said, analysing Google Search Console metrics comes with structural limitations. Raw data incorporates confounding variables such as seasonality, natural brand growth and Google Core Updates. This is precisely where SEO intelligence platforms like SearchLens come in. By mathematically isolating these external factors, the tool transforms Google Search Console statistics into a scientific measure of impact, complete with precise statistical confidence scores. You move from merely observing fluctuations to genuinely understanding the causal effect of your SEO actions.
The “Performance” Report: Where Your Data Comes to Life
The performance report centralises the key indicators of your organic visibility on the search network.
Accessing and Configuring the Report
Access the report via the “Performance” tab in the left-hand navigation menu. Initial configuration requires setting strict filters: search type (Web, Image, Video), date range and specific dimensions (queries, pages, countries, devices). Following recent updates, Google has introduced a real-time view. Data less than 24 hours old is displayed with dotted lines because it remains incomplete and preliminary. These recent statistics, while useful for detecting an immediate technical issue or indexing error, should not be used as the basis for calculating definitive Google Search Console metrics or evaluating long-term strategy performance.
Overview of Available Data
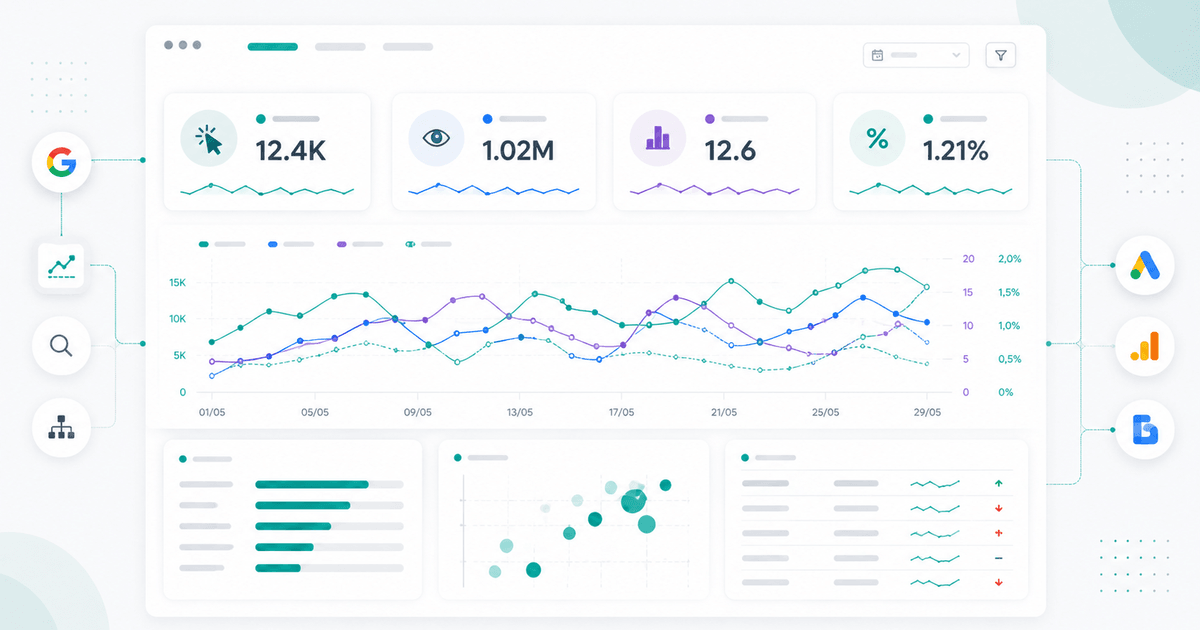
The dashboard displays four cardinal metrics: total clicks, total impressions, average CTR and average position. These Google Search Console indicators can be cross-referenced against six analysis dimensions for maximum granularity. The interface limits native exports to 1,000 rows, which often requires using the API for large-scale data extractions.
GSC also caps its history at 16 months, which makes year-over-year analysis on older data impossible directly in the interface. SearchLens lifts both of these constraints: it gives you access to your full query history beyond 16 months and surfaces all your queries, not just the first 1,000 rows — so no long-tail keyword goes unnoticed.
💡 Analysez toutes vos requêtes GSC sans la limite des 1000 lignes : Débloquer toutes mes requêtes →
During analysis, the inherent volatility of search algorithms generates significant statistical noise. To obtain a reliable reading, it is essential to smooth out daily fluctuations by analysing trend data on a weekly or monthly basis. A year-over-year (YoY) comparison over rolling 28-day periods offers the most accurate representation of your organic growth. Integrating this data into statistical models allows you to isolate genuine performance gains from simple seasonal variations in search volume.
Key Google Search Console Metrics Decoded
Each GSC indicator has a strict technical definition that must be mastered to avoid analytical bias.
Impressions: Your True Visibility in Search Results
Impressions correspond to the number of times your site appears in Google’s results, whether in standard web search, Discover or Google News. An impression is counted as soon as the URL appears on the results page loaded by the user, even if they do not scroll down to your link.
The rule differs for carousels or rich results: the element must be visible on screen to generate an impression. Analysing Google Search Console metrics related to impressions helps you assess the size of your organic addressable market. A rise in impressions without a corresponding increase in clicks often signals a mismatch with search intent or positioning below the fold (typically beyond position 5).
Clicks: When Users Take Action
Clicks represent the number of times a user accesses your site from a Google results page. Unlike sessions measured by other tools, a click in GSC corresponds to a single outbound navigation action from the search engine.
If a user clicks your link, returns to the SERP and then clicks the same link again, only one click is counted. However, if they click two different links from your domain for the same query, two clicks are recorded. This metric is the most direct indicator of organic traffic acquisition. Its volume is intrinsically tied to the URL’s ranking position and the appeal of the title tag and meta description.
Click-Through Rate (CTR): The Benchmark for High-Performing Titles
CTR (Click-Through Rate) measures the effectiveness of your snippets in the SERPs. The calculation is straightforward: divide total clicks by total impressions, then multiply by 100 to get a percentage. For example, 50 clicks from 1,000 impressions yields a CTR of 5%.
This Google Search Console metric is the barometer of your semantic appeal. A CTR below market averages for a given position (approximately 28% for position 1, 15% for position 2) signals a mismatch between your title tag and user intent. CTR optimisation is the SEO lever with the fastest return on investment, since it capitalises on impressions already earned.
Average Position: A Metric That Requires Perspective
Average position is often the most misinterpreted metric among marketing professionals. It corresponds to the average ranking of your site’s highest-ranked result for a given query. If your domain occupies positions 3 and 7 for the same search, GSC will only retain position 3 when calculating the average.
This statistic is dynamically calculated based on the user’s location (geo), their preferences and the device used (mobile or desktop). An average position of 4.5 does not mean you are always ranked 4th or 5th; it may result from a mix of position 1 rankings on long-tail queries and position 20 rankings on generic terms.
To use Google Search Console metrics effectively, never look at the overall average position for the entire property. Always segment this data by page or by exact query. A drop in average position can paradoxically be a positive signal: if an article starts ranking for new high-volume queries, these new distant impressions will mathematically drag down the URL’s overall average.
From Analysis to Action: Turning Metrics into Concrete Optimisations
Data collection only has value when it leads to measurable corrective actions.
Segmenting Data for Precise Insights
A global analysis of Google Search Console statistics masks true performance dynamics. Segmentation is essential. Group queries by actual search intent using artificial intelligence or regular expressions (RegEx).
Systematically separate branded traffic from non-branded traffic. Overall growth can hide a critical drop in your generic queries, masked by an offline brand awareness campaign. Also segment by page type (blog posts, product pages, category pages) to identify underperforming templates. This granularity allows you to isolate variables and apply targeted SEO fixes to the semantic clusters with the greatest conversion potential for your clients.
Identifying Quick-Win Opportunities
SEO quick wins are hidden in the positive anomalies within your Google Search Console metrics. Filter your data to isolate queries ranked between 4th and 10th position, generating more than 1,000 impressions over the past 28 days, but displaying a CTR below 3%.
These keywords represent an immediate traffic opportunity. A simple rewrite of the title tag to include action-oriented terms or relevant named entities can drive CTR up. Similarly, adding semantically targeted content to the landing page for these specific queries is often enough to gain the few positions needed to reach the top 3, multiplying traffic by a factor of 5 to 10.
Diagnosing and Resolving Performance Drops
When traffic drops, responsiveness is critical. Use the preliminary data from the last 24 hours to quickly spot performance anomalies, such as a mass de-indexation or a sudden algorithmic penalty.
Compare exact periods (for example, the last 7 days versus the previous 7 days) by filtering on “Click difference.” Identify whether the drop originates from a specific group of URLs, a country or a device type. Then check the position metric: if position remains stable but impressions drop, the issue lies with overall demand. If position collapses, the problem is technical or related to a search engine update.
Prioritising Your Optimisation Strategies
SEO resource allocation must be grounded in quantifiable data. Use Google Search Console metrics to build a priority matrix based on effort and potential impact. Focus your link-building and content budgets on “striking distance” pages (positions 11 to 15) that already have an impression history validated by Google.
To scientifically validate the ROI of these optimisations, solutions like SearchLens are indispensable. The platform isolates the 4 variables that typically distort SEO measurement: seasonality, natural site growth, overlap between actions, and Google Core Updates. The result: a delta of incremental clicks with a confidence score. No more “I think it worked.” This approach transforms SEO from an uncertain cost centre into a predictable acquisition lever.
Beyond Basic Metrics: Cross-Referencing Data for a Complete Picture
Enriching GSC data with other sources provides an exhaustive map of the user journey.
Comparing Search Console and Google Analytics Data
Integrating both tools is a technical necessity. Google Analytics focuses on behavioural analysis after users arrive on the site, measuring KPIs such as engagement rate, conversions and time spent.
| Characteristic | Google Search Console | Google Analytics |
|---|---|---|
| Journey phase | Pre-click (SERP) | Post-click (On-site) |
| Primary measure | Impressions, Clicks, CTR, Position | Sessions, Engagement, Conversions |
| Cookie impact | None (server-side measurement by Google) | High (depends on user consent) |
| Analysis focus | Technical health and SEO visibility | Visitor behaviour and UX |
Discrepancies between the two platforms are normal. Analytics depends on JavaScript execution and cookie consent, leading to data loss (often 20 to 30%). Conversely, GSC records the click at the server level, independently of ad blockers.
Analysis by Search Type: Web, Images, Videos, Discover
Organic traffic is no longer limited to traditional blue links. The search type filter allows you to isolate performance on Google Images, Google Videos and the Discover ecosystem. The latter requires separate analysis since its algorithm is based on user interests rather than explicit queries.
The evolution of SERPs demands constant technological monitoring. AI reports (not yet available in all regions) will make it possible to analyse impressions and pages visible in AI Overviews (SGE). Anticipating these new Google Search Console metrics is vital to adapt your technical content strategies and maintain visibility in the face of the engine’s generative responses.
Integrating Other GSC Reports: Core Web Vitals and Coverage
Evaluate the quality of your URLs with the Core Web Vitals report, based on CrUX (Chrome User Experience Report). This report uses real-world field data to measure user experience.
The interface allows you to classify URLs by status (Poor, Needs improvement, Good) and by metric type such as CLS (Cumulative Layout Shift), INP (Interaction to Next Paint) and LCP (Largest Contentful Paint). Resolving indexing errors in the coverage report (crawled but not indexed pages, 404 errors) is an absolute prerequisite before any attempt at semantic optimisation.
Conclusion: Mastering GSC Metrics for High-Performance SEO
Rigorous use of Google Search Console metrics separates empirical SEO strategies from genuinely scientific approaches. Impressions, clicks, CTR and average position are not merely performance indicators; they are technical diagnostic data that reveal how Google’s algorithms perceive and evaluate your domain.
For demanding B2B professionals, the challenge is no longer simply collecting these statistics, but cleaning them of their inherent biases. By relying on advanced intelligence tools capable of isolating confounding variables, you transform this raw data into irrefutable ROI evidence. Mastering this analytical ecosystem ensures precise, proactive and highly profitable management of your organic visibility.
Frequently Asked Questions About Google Search Console Metrics
Find technical answers to the most common questions about search data analysis.
What is the difference between Google Analytics and Google Search Console?
Search Console analyses the pre-click stage; Google Analytics handles post-click tracking. GSC measures your visibility and interactions directly on search engine results pages (SERPs), while Analytics quantifies user behaviour, engagement and conversions once they are browsing your domain.
What is the difference between impressions and clicks in Google Search Console?
Impressions measure display in results (the presence of your link on the SERP loaded by the user), while clicks validate the action (the actual transfer of the user to your website). An impression represents a visibility opportunity, whereas a click constitutes a real organic traffic acquisition.
What is Google Search Console?
Google Search Console is a free service provided by Google that allows webmasters and SEO professionals to monitor, maintain and troubleshoot their site’s presence in search results. It provides critical technical data on indexing, crawling, query performance and user experience (Core Web Vitals).
How should I interpret a drop in impressions?
A drop in impressions generally indicates an overall loss of visibility, which can stem from a ranking decline following an algorithm update, a technical issue preventing your pages from being indexed, or a natural decrease in search demand. Cross-reference this metric with average position and isolate the variables to identify the exact root cause.
Essayez sur ce cas d'usage
Passez de l'analyse manuelle au pilotage SEO en continu
SearchLens agrège vos données Google Search Console, Google Ads et GA4, conserve l'historique complet et fait ressortir ce qui bouge — sans export CSV, sans requête SQL.
Essayer SearchLens — 7 jours sans CBEssai 7 jours · pas de carte bancaire · annulation en 1 clic.
- Historique illimité au-delà des 16 mois de GSC
- Détection automatique des pages en déclin
- Segmentation brand / non-brand en un clic
À lire également
How to Analyze Google Search Console Performance: The Complete Guide
Master Google Search Console's Performance report: 4 key metrics explained, weighted average position, quick wins from page 2, and traffic-drop detection before it hits.
Brand Performance Tracking in GSC: Signals That Reveal Your True SEO Health
Track brand performance in Google Search Console: advanced filters, key signals and interpretation of navigational queries to defend your SEO territory.
GSC External Links Report: How to Use It to Analyze Your Backlinks
Leverage Google Search Console's external links report to audit your backlinks, spot toxic domains and optimize the internal distribution of your domain authority.