How to Analyze Google Search Console Performance: The Complete Guide
Master Google Search Console's Performance report: 4 key metrics explained, weighted average position, quick wins from page 2, and traffic-drop detection before it hits.
Analyzing Google Search Console performance is the step that separates decorative SEO tracking (curves go up or down, we discuss them in meetings) from data-driven management (we identify declining pages, take action, measure results). This guide details the technical methods for reading the Performance report with rigor — and recognizing the structural blind spots of the native interface that make an additional analytics layer necessary.
Key Takeaways
- GSC delivers server-side data (never blocked by adblockers, never dependent on a JS script): it’s the source of truth for measuring real visibility in the SERPs.
- The interface caps at 1,000 rows per report and 16 months of history — the long tail (60-70% of traffic) remains invisible and year-over-year comparison is impossible beyond one cycle.
- The native average position is an unweighted arithmetic mean: it masks critical drops on high-volume queries. Impression-weighted position is essential for effective management.
- Quick wins hide in positions 11-20 on queries with >500 impressions/month: gaining 3-4 positions can multiply traffic by 10 on those URLs.
- Detecting declining pages before the visible drop requires crossing three signals: M-1 delta, Y-1 delta (seasonality), and a drop in weighted position.
Decoding the Google Search Console Performance Report
The Performance report is the most reliable primary source for evaluating a website’s organic acquisition on Google.
The Foundation of Any Reliable SEO Analysis
To analyze Google Search Console performance accurately, you need to understand the nature of the data. Unlike analytics solutions based on scripts (which can be blocked by adblockers, GDPR cookie refusals, or simply slow load times), GSC returns data directly from Google’s servers. It’s the only source of truth for measuring your visibility in the SERPs.
The native user interface has three major technical limitations for mature SEO profiles:
- Silent sampling on high-traffic sites and a display limit of 1,000 rows per report.
- History strictly capped at 16 rolling months — preventing any long-term trend analysis or Year-over-Year comparison across multiple cycles.
- No delta sorting in the comparison tool — to identify declining pages, you must export to CSV and calculate manually.
Experts therefore turn to the Search Analytics API (free, requires code) or BigQuery bulk export (official since 2023) to work around these caps and build actionable dashboards.
Setup and First Steps in the Interface
The reliability of your analysis depends directly on the initial property configuration:
- Domain property (DNS validation): automatically aggregates all site variations (http, https, www, non-www) as well as all subdomains. Recommended default configuration.
- URL prefix (HTML tag, file, GA, GTM): only surfaces the exact specified path. Useful for isolating a subdomain or tracking a migration.
Once the property is validated, the report updates with a 24 to 48-hour latency. Regularly check the Coverage section to ensure that the pages generating impressions are the intended canonical versions: poor canonicalization fragments your metrics across multiple URLs and distorts decisions.
The 4 Metrics That Reveal Your True SEO Performance
Evaluating organic traffic relies on four fundamental indicators that must be interpreted together.
What Each Metric Actually Tells You About Your Visibility
The interface displays four main metrics that model the SEO funnel, from appearing in results to the actual visit. Analyzing them in isolation frequently leads to errors; they must be cross-referenced.
| GSC Metric | Technical Definition | What It Tells You About Your SEO |
|---|---|---|
| Impressions | Number of times the URL appeared in a SERP, even if not scrolled to (except image search). | Raw visibility volume and potential market size on your target keywords. |
| Clicks | Number of interactions that bring the user to your site (excludes internal sitelinks). | Actual organic traffic generated. The acquisition metric par excellence. |
| CTR | Clicks ÷ impressions × 100. | Attractiveness of your snippet (Title, meta description, structured data) against the competition. |
| Average Position | Average ranking of the best-ranked URL for a given query. | Relevance granted by the algorithm to your content vs. search intent. |
Typical cross-reading: rising impression volume paired with falling CTR indicates your new pages are ranking on page 2-3 — visibility without audience capture.

Average Position: Useful, But Handle With Care
The native average position is mathematically misleading. The tool calculates a simple arithmetic mean. If your site appears in position 1 for a query with 10 impressions, and in position 100 for a query with 10,000 impressions, the raw average will be heavily skewed and won’t reflect your real visibility.
To address this distortion, you need to calculate the impression-weighted average position. This method assigns a weight proportional to the volume of each query: a position drop on a very high-volume keyword will logically impact the overall average, immediately alerting the SEO. Conversely, fluctuations on anecdotal long-tail queries are smoothed out.
This is one of the reasons why exporting and reprocessing data (via API, BigQuery, or a third-party tool) quickly becomes necessary: weighted position simply cannot be calculated in the native UI.

Digging Into Your Data to Uncover Hidden Opportunities
The interface imposes filtering restrictions that must be worked around to conduct granular, actionable analysis.
Multi-Dimensional Analysis: Queries, Pages, Geolocation, Devices
To analyze Google Search Console performance comprehensively, segment the data across multiple dimensions:
- Queries: identify the exact search intents of your users.
- Pages: pinpoint the URLs driving growth.
- Device (mobile vs. desktop): Mobile-First indexing generates rankings that can differ radically by device.
- Country: essential for international sites; isolates the performance of a specific market.
The interface significantly limits this analysis by displaying only 1,000 rows of results. For e-commerce sites or media properties generating traffic across tens of thousands of keywords, this limit hides the long tail — often 60 to 70% of total organic traffic. Bulk extraction via the API or BigQuery allows you to map the entire semantic landscape, identify emerging low-volume but high-conversion queries, and detect cannibalization where multiple pages compete on the same keywords.
💡 See your declining pages over 16+ months, with weighted position: Analyser mes pages en déclin →
Time Comparisons and Filters to Isolate Signal From Noise
Identifying SEO trends requires comparing equivalent periods to neutralize seasonality:
- Month-over-Month (MoM): useful for measuring the immediate impact of a production deployment.
- Year-over-Year (YoY): the only comparison that reveals true organic growth by isolating seasonality effects.
Using regular expressions (regex) in GSC filters is an essential advanced technique: a regex filter on the spelling variations of your brand name lets you isolate the performance of generic (non-branded) queries — the true indicator of your acquisition strategy.
The main technical obstacle remains the 16-month retention limit. It’s impossible to compare a seasonal event (Black Friday, sales periods) across three or four years via the native interface. Without third-party archiving, your data older than 16 months is permanently lost — along with any ability to prove the long-term impact of a site redesign or content marketing strategy.
From Analysis to Action: Building Your Optimization Plan
Data only has value when it translates into measurable corrective actions.
Identifying Quick Wins on Page 2
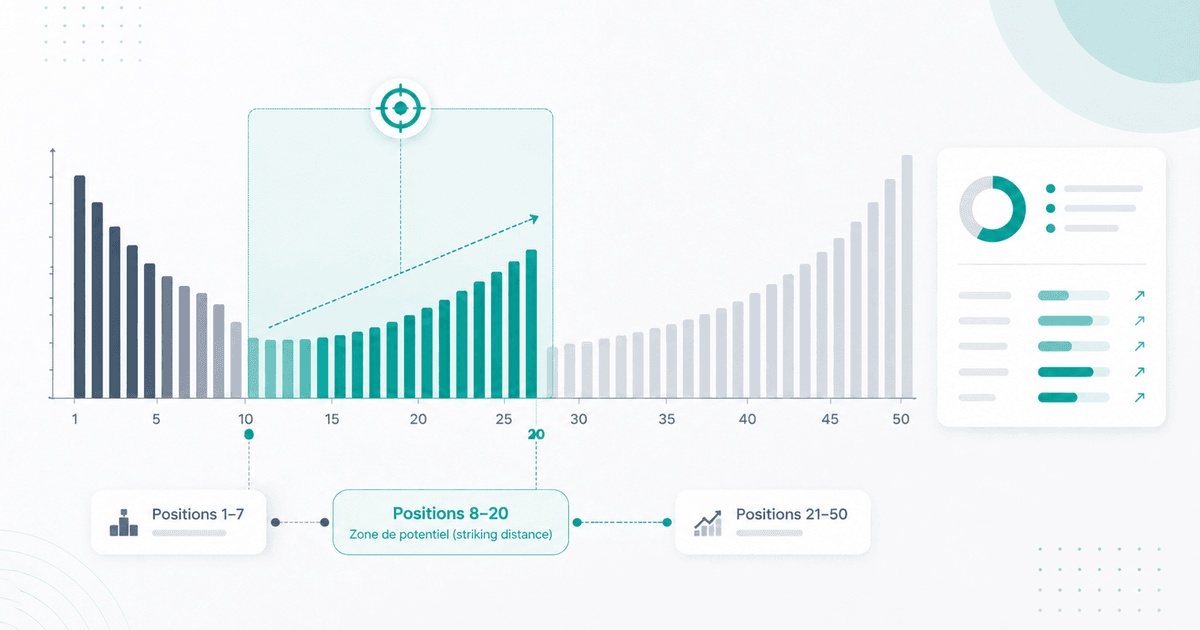
One of the most cost-effective methods is identifying keywords ranking between positions 11 and 20 — the second page of results. These queries often generate significant impression volume but near-zero clicks: fewer than 1% of users click beyond page 1.
Method:
- Export your data and filter for queries with >500 monthly impressions and an average position between 10.5 and 20.
- For each identified page, optimize:
- Internal linking: add links from your most powerful pages (homepage, category hubs, pages with high internal PageRank).
- Content semantics: add paragraphs specifically addressing the queries for which you’re on page 2.
- Core Web Vitals: LCP, INP, CLS — Google uses these as ranking signals.
A simple improvement of 3 to 4 positions on these “striking distance” keywords can multiply your traffic by 10 on those specific URLs, without requiring the creation of new content.
Detecting and Addressing Drops Before It’s Too Late
Reactivity is key. An organic traffic loss can stem from an algorithmic penalty (Core Update), a technical issue (accidental noindex tag, degraded load time), or lost backlinks. The GSC interface forces users to manually hunt for these anomalies — which means discoveries often come several weeks after the problem first appeared.
Manually analyzing declines is complex because a drop in clicks can simply come from a drop in overall demand (seasonality), not a loss of ranking. Without separating the two, you end up chasing ghosts.
Proactive triage requires crossing three signals:
- M-1 delta (month-over-month): is the drop recent?
- Y-1 delta (year-over-year): is this seasonality or a real loss?
- Weighted position: is the click drop accompanied by a position drop, or simply a decrease in demand?
If all three signals are red, it’s a genuine visibility loss — investigate the page, internal linking, recent Core Updates, and fix it immediately.
Boosting Your CTR With Targeted Optimizations
CTR is an optimization lever that’s often underestimated. At the same position, a higher CTR mechanically generates more traffic and sends a positive signal to the algorithm — which can consolidate your ranking.
Average benchmarks (use with caution as they vary by industry and SERP type):
- Position 1: 28-32% CTR.
- Position 3: approximately 10%.
- Position 5: less than 5%.
If your pages show a CTR significantly below these thresholds, optimize:
- Title tag: more compelling (numbers, action verbs, current year).
- Meta description: a precise answer to the search intent.
- Structured data (Schema.org): FAQ, Review, Breadcrumb — increase visual real estate in the SERP and click probability.
Combining Search Console and Analytics for a Complete Picture
Aligning search data with on-site behavior is crucial for calculating ROI and understanding the user journey.
GSC Clicks vs. GA4 Sessions: Why the Numbers Differ
A major source of confusion: the systematic difference between GSC Clicks and GA4 organic sessions. These two metrics technically cannot be identical due to fundamentally different collection methodologies.
| Technical Criterion | GSC Clicks | GA4 Sessions |
|---|---|---|
| Collection method | Google server-side data (from the SERP). | JavaScript script executed client-side (browser). |
| Bot filtering | Excludes bots known to Google. | Depends on GA4 settings + JS execution. |
| Ad blockers | No impact — the click is recorded. | Sessions not recorded if the script is blocked. |
| Time zone | Pacific Time (PT). | Time zone configured in the GA4 property. |
| Session logic | 1 click = 1 click, regardless of behavior. | New session after 30 minutes of inactivity. |
As a general rule, GA4 sessions are 15 to 30% lower than GSC clicks, due to cookie blocking (GDPR, Consent Mode) and load times long enough to cause users to leave before the script executes.
To manage seriously, you must accept this structural gap and never try to reconcile the two figures exactly. Analyze trends on each source, not absolute values.
Measuring the Real Impact of Your Optimizations on Conversions
The ultimate goal of SEO is not to generate clicks, but conversions. Combining GSC data with GA4 conversion events lets you identify the keywords that actually generate revenue.
The analytical challenge: proving that an increase in conversions is directly linked to a specific SEO optimization, rather than external factors (seasonality, natural market growth, a favorable Core Update, or simply luck). Raw correlations like “I published article X, my conversions went up the following week” don’t hold up under rigorous analysis.
To obtain stronger proof, mathematically isolating the effect of your work from external factors requires statistical models (CausalImpact, time series with counterfactuals) that go beyond the scope of the native GSC UI. This is precisely the type of analysis for which a third-party analytics layer becomes relevant — not to replace GSC, but to fully exploit the data it delivers.
Conclusion: Mastering GSC to Drive a Data-Driven SEO Strategy
Analyzing Google Search Console performance must go beyond passively observing curves to become a management tool. By mastering the technical nuances (impressions, clicks, weighted position, CTR by position) and working around the interface’s limitations (1,000 rows, 16 months, poor sorting), you transform raw data into actionable decisions.
The goal: shifting from a reactive posture (noticing drops after the fact) to a proactive one (automated detection of weak signals, continuous CTR optimization, tagging SEO actions over time). With this discipline, GSC becomes what it was always designed to be: the daily compass of data-driven SEO.
Frequently Asked Questions About GSC Performance Analysis
Why Do GSC and Analytics Numbers Differ?
GSC records a click directly from Google’s SERP; Analytics only counts a session if the JavaScript script loads on your site. Cookie blockers, GDPR consent refusals, different time zones, and different session logic explain the structural gap (15-30% on average).
How Often Should You Analyze Performance to Stay Reactive?
Weekly checks of global metrics to detect technical anomalies or sudden drops. For in-depth analysis and strategic reporting, a monthly extraction cross-referenced with the previous year (YoY) is the industry standard.
How Do You Identify Queries With the Highest Untapped Potential?
Filter your data to isolate keywords ranking between positions 11 and 20 generating more than 500 monthly impressions. Semantic optimization and strengthening internal linking on these pages offers the best effort-to-result ratio for acquiring traffic quickly.
What Should You Do When Impressions or Clicks Drop Sharply?
First check the indexing report to rule out a technical issue (404, noindex tag, canonical problem). If the technical side is healthy, analyze the weighted average position to distinguish a ranking loss against competitors from a simple drop in seasonal demand.
Is the GSC Average Position Reliable?
Yes for identifying general trends, no for making strategic decisions. The native average is not weighted by impressions and smooths out critical variations on high-volume queries. Impression-weighted position, calculated outside the native UI, is necessary for serious management.
Essayez sur ce cas d'usage
Détectez vos pages en déclin avant qu'elles vous coûtent du CA
SearchLens identifie automatiquement les pages qui perdent des clics vs le mois dernier ou l'année dernière, avec le détail des requêtes responsables — en un clic.
Analyser mes pages en déclin →Essai 7 jours · pas de carte bancaire · annulation en 1 clic.
- Top 100 gagnants / perdants par page et par requête
- Comparaison M-1 et N-1 avec filtres saisonniers
- Drill-down automatique sur les requêtes responsables
À lire également

Set Up Google Search Console Step by Step: The Complete Guide
Set up Google Search Console step by step: Domain vs URL-prefix property, DNS validation, sitemap submission, and indexation. Key methods and native limits to know before you start.

Google Search Console: The Complete Guide to Mastering Your SEO in 2026
Everything you need to know about Google Search Console: setup, key metrics, tool limitations, and practical workflows to turn raw data into actionable SEO decisions.
SEO Keyword Optimization: How to Turn Positions 8–20 Into More Clicks
Method to identify striking distance pages (positions 8–20) in GSC, prioritize high-potential URLs, and measure impact without getting misled by seasonality.