How to Detect Your Declining Pages in Google Search Console (Without Spending Two Hours in Excel)
A repeatable workflow to spot pages losing clicks vs. last month or last year, identify the queries behind the drop, and prioritize the actions that will actually move the needle.
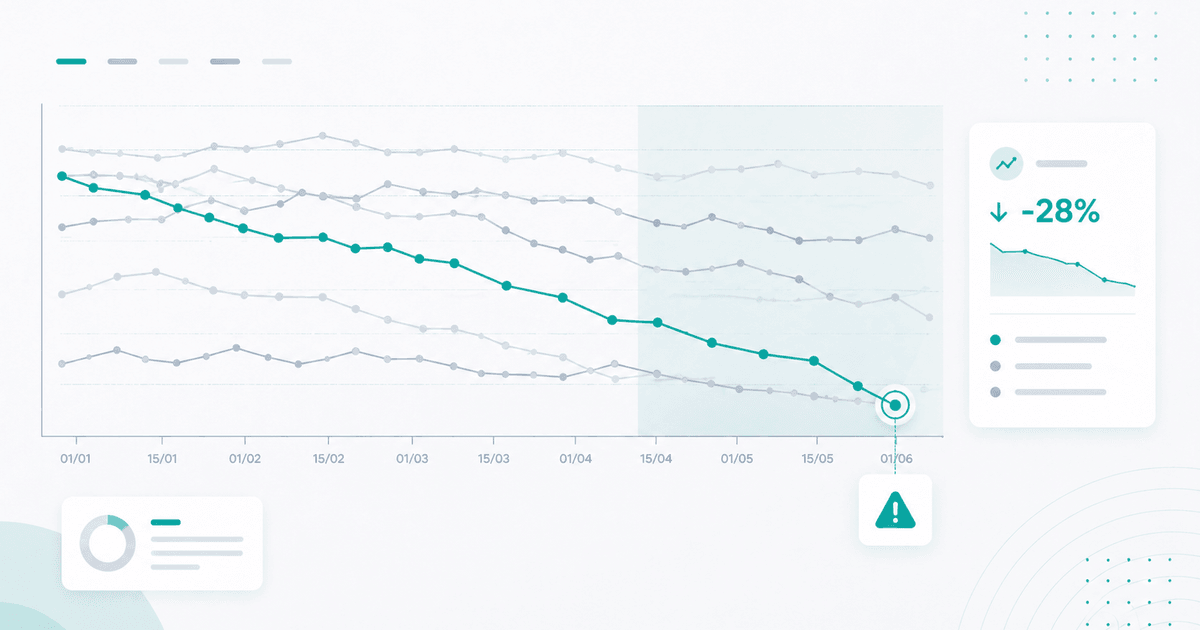
The majority of SEO traffic drops don’t come from a sudden crash. They come from an accumulation of small losses across dozens of pages that nobody looks at because none of them trigger an alert. By the time you finally see the total drop on the monthly dashboard, the damage is done — and you have to go back week by week to understand what happened.
This article describes a concrete workflow for catching these pages before they cost you revenue, without spending two hours in Excel.
Why Google Search Console Alone Isn’t Enough
The GSC interface is designed for exploration, not monitoring. Three recurring limitations:
- 1,000-row maximum in the page-level comparison view. On an average site, that’s well below the number of indexed pages.
- 16 months of rolling history. Properly comparing to the previous year is impossible if you’re in mid-2026.
- No sorting by delta. You sort by absolute clicks, then have to manually recalculate deltas for each URL.
The result: you run the analysis at the end of the month, miss what moved in week 2, and discover it in week 4 on the global trend line.
The Three Signals That Actually Matter
To reliably detect a declining page, you don’t look at a single number. You look at three signals in parallel:
1. The M-1 Click Delta
Month-over-month comparison is the right first filter: it neutralizes most weekly variations (holidays, editorial scheduling, crawl cycles). A page that loses 20% of clicks M-1 over two consecutive periods is no longer an anomaly — it’s a pattern.
2. The Y-1 Click Delta
Essential for sites with strong seasonality (e-commerce, travel, finance). A page that gains +10% M-1 but loses -30% Y-1 is actually declining — the season is just favorable. Without Y-1, you’re flying blind.
3. Impression-Weighted Average Position
A page that drops from position 3 to position 6 loses CTR. But a simple AVG(position) in GSC is biased: it weights all queries equally. The right calculation is SUM(position × impressions) / SUM(impressions) — the position your users actually see.
💡 Envie de voir ce workflow sur vos données ? Analyser mes pages en déclin →
The 4-Step Workflow
Step 1 — List Pages That Have Lost Clicks
Export your GSC data for the most recent period (last 28 days) and the comparison period (previous 28 days). On a site with 10,000 URLs, that means 10 exports of 1,000 rows each — plan on using the API or a tool that reads BigQuery directly.
For each URL, calculate:
- Clicks for the current period
- Clicks for the previous period
- Absolute delta
- Delta %
Filter on delta < 0 and sort by absolute delta descending. You now have your top 50 losing pages.
Step 2 — Filter Out False Positives
Not every loss is a problem. Exclude:
- Pages with fewer than 50 clicks in the reference period (statistical noise).
- Pages intentionally de-indexed or whose URL has changed (refactor).
- Pages with a -10% delta but Y-1 +40% (favorable seasonality, false positive).
After this filtering, you’re typically left with 10 to 20 pages worth investigating.
Step 3 — Drill Down by Query
For each page, find the 3–5 queries responsible for the drop. This is where the work gets interesting:
- Stable position, declining CTR → title/description issue, intent poorly covered.
- Declining position, stable CTR → new competitor at the top of the page, technical overhaul on Google’s end.
- Declining impressions → keyword volume eroding, intent shifting to a different formulation.
Step 4 — Prioritize Action
Not everything gets treated the same way. For each declining page, three questions:
- What is it costing? Lost clicks × value per click (ideally via GA4 or CRM).
- What does fixing it cost? Full rewrite vs. a simple title adjustment?
- Is there a pattern? If 5 pages in the same category are all declining at the same time, that’s a signal of a structural problem — not a page-by-page issue.
What You Recover in 20 Minutes
With a tool that automates this workflow, here’s what you get per client, per month:
- The list of the top 10 declining pages prioritized by estimated lost revenue.
- The queries responsible for each drop, with the impressions / CTR / position breakdown.
- The M-1 and Y-1 trend for each URL to confirm you’re not looking at a seasonal false positive.
- A log of past actions to see what was tried and what worked.
The remaining time (3.5 hours saved out of 4 hours of reporting) goes toward fixing actual problems.
Linear Regression vs. Raw Delta: The Filter That Changes Everything
The three signals described above (M-1 delta, Y-1 delta, weighted position) are still snapshots at a point in time. On volatile sites — seasonal, e-commerce with promotions, news media — these deltas generate a lot of false positives: a page that swings between +25% and -20% week over week will trigger alerts almost every month without any action being necessary.
The most robust method for separating noise from real decline is linear regression over 90 days. Instead of comparing two adjacent periods, you calculate the slope of the line that best fits the time series. A clearly negative slope is a signal of structural decline, independent of the raw delta over the last 28 days.

The diagram above illustrates what we regularly observe: Page A with an M-1 delta of -18% that looks alarming (left panel, volatile orange curve) actually has a near-flat linear regression over 90 days — it’s a false positive. Conversely, Page B with an apparently less critical delta of -10% (right panel, red curve) hides a regression of -34% over the same window — a structural decline to address as a priority.
In practice, the criterion we use in production is: 90-day regression below -15%, with R² > 0.3 (minimum goodness-of-fit to exclude pure noise). Below this threshold, the decline isn’t “trend-like” enough to justify an SEO intervention — we monitor, but we don’t touch.
Two Common Scenarios You’ll Almost Always Encounter
Case 1 — The Zombie Page Consuming Crawl Budget
A URL that was getting 2,000 clicks/month a year ago, now getting 200, with a linear regression pointing toward 0 in 6 months. This isn’t a case where you “try to recover” — it’s a case where you archive or completely rewrite.
The classic trap: a team that keeps patching a dying URL (refreshing the title, adding a few paragraphs, rebranding the H1) instead of acknowledging that the topic has become marginal and that the URL is now dragging down the site’s average authority without contributing any clicks. A continuously negative linear regression despite 3 successive patches is the clearest signal that you need to change strategy: either merge with a stronger URL in the same cluster, apply a clean noindex, or rewrite for a new angle.
Case 2 — The Sub-Cluster Declining Simultaneously
Five URLs in the same category all losing 15–25% of clicks over 90 days, without any single one individually crossing a critical alert threshold. This is the hardest signal to spot manually (because you’re looking page by page) and the one that reveals a structural problem: a recent template overhaul for the category, loss of authority in the silo, a shift in intent on Google’s side, a competitor that published a complete cluster.
Automated detection requires grouping (by page type, category cluster, or silo in the site architecture) and calculating an aggregated regression across the cluster. When the cumulative slope of the group is more negative than that of each individual page, there’s a cluster-level signal — not a per-URL problem.
This two-level analysis (page + cluster) is what separates an audit that finds real levers from one that simply lists losing pages one by one.
Going Further
This workflow holds up manually for a single site, provided you dedicate several hours per month to it and maintain rigorous discipline. Beyond the 3rd site managed or the 4th monthly reporting cycle, the time-to-value ratio flips: a dedicated tool typically pays for itself within 2 months on productivity gains alone.
SearchLens automates precisely the 4 steps described here — GSC exports without the 1,000-row cap, 90-day linear regression on every page and every cluster, one-click query-level drill-down, and action tagging directly on the trend curves to measure what’s working. The time you save, you reinvest where you actually add value: producing, structuring, linking.
Essayez sur ce cas d'usage
Détectez vos pages en déclin avant qu'elles vous coûtent du CA
SearchLens identifie automatiquement les pages qui perdent des clics vs le mois dernier ou l'année dernière, avec le détail des requêtes responsables — en un clic.
Analyser mes pages en déclin →Essai 7 jours · pas de carte bancaire · annulation en 1 clic.
- Top 100 gagnants / perdants par page et par requête
- Comparaison M-1 et N-1 avec filtres saisonniers
- Drill-down automatique sur les requêtes responsables
À lire également
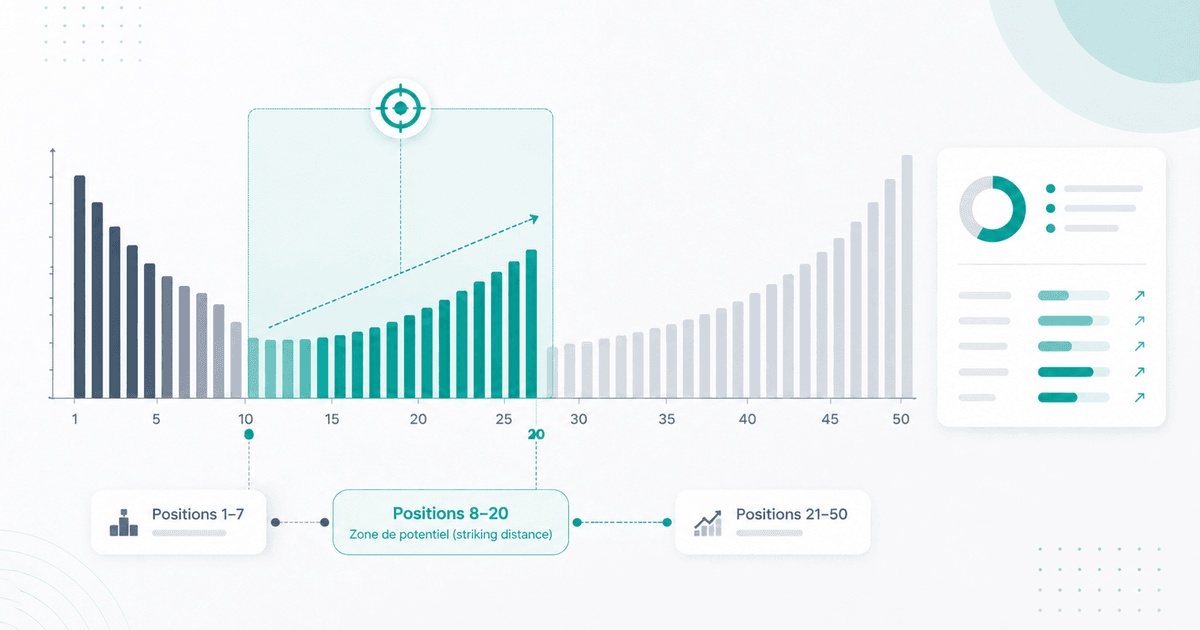
SEO Keyword Optimization: How to Turn Positions 8–20 Into More Clicks
Method to identify striking distance pages (positions 8–20) in GSC, prioritize high-potential URLs, and measure impact without getting misled by seasonality.

SEO Cannibalization: How to Identify It Without False Alarms (and Fix It Without Breaking Everything)
Not all duplicates are cannibalization. A pragmatic method to spot real cases, measure the true cost, and fix them without breaking what's already working.
How to Analyze Google Search Console Performance: The Complete Guide
Master Google Search Console's Performance report: 4 key metrics explained, weighted average position, quick wins from page 2, and traffic-drop detection before it hits.