Google Search Console: The Complete Guide to Mastering Your SEO in 2026
Everything you need to know about Google Search Console: setup, key metrics, tool limitations, and practical workflows to turn raw data into actionable SEO decisions.

Google Search Console is the only SEO tool that sees what Google actually sees on your site. It’s also the one most teams underuse — either skimming the surface (the Performance tab and nothing else), or looking in the wrong direction (hunting for precise rankings where GSC only delivers smoothed averages).
This guide covers everything: what Google Search Console is actually for, which metrics drive what, its three structural limitations nobody tells you about, and how to build a workflow that turns raw data into SEO decisions — without spending two hours a week exporting CSVs.
Understanding Google Search Console
What GSC is — and what it isn’t
Google Search Console is the official, free interface that exposes the data Google holds about your site in its index. Three things to keep in mind:
- GSC is not a rank-tracking tool. It doesn’t show the position of a URL at a specific moment for a given query. It delivers the average position of a URL over a time window, aggregated across all the personalized SERPs Google has served (geolocation, device, user history).
- GSC is not an offsite SEO tool. It shows you what’s happening between Google and your site: crawl, indexation, search analytics, sitemaps, schema issues. Backlinks and competitive analysis are not its domain.
- GSC is the source of truth for two specific things. First, organic performance in terms of impressions / clicks / CTR / position from Google’s search engine. Second, technical indexation health (crawled vs. indexed URLs, crawl errors, mobile issues, invalid schema).
Everything else — competitive analysis, uncovered keywords, domain authority — belongs to other tools (Ahrefs, Semrush, Sistrix, etc.). Conflating the two worlds is the most common source of bad SEO reporting.
The 4 pillars of the interface
The Google Search Console interface is built around four pillars, which you open in this order when seriously monitoring a site:
1. Performance. The most-used tab, for good reason. It delivers the 4 core organic metrics — clicks, impressions, CTR, average position — segmentable by query, page, country, device, and search type (web, image, video, news). This is where 80% of actionable SEO diagnosis lives.
2. Page Indexing. What Google has successfully (or not) indexed. Three statuses to know: Indexed (visible in results), Discovered – currently not indexed (Google knows the URL but hasn’t crawled it or deemed it a priority), Crawled – currently not indexed (Google saw it but set it aside — often duplicate content, thin content, or weak quality signals). This report should be read before pushing any new content strategy.
3. Sitemaps + URL Inspection. The declared sitemap plus ad-hoc inspection of a URL to see its Google status in near real time: last crawl date, indexability, indexed mobile/desktop version, detected schema, any JS errors. It’s the equivalent of curl --verbose on Google’s side.
4. Enhancements (Core Web Vitals + mobile usability + structured data). The UX and markup signals Google uses (or claims to use) for ranking. Worth monitoring but worth calibrating — degraded Core Web Vitals alone have never tanked a SERP, but a cumulation of weak signals can shift a position from 4 to 7 on competitive queries.
The 4 organic metrics to know cold
| Metric | What it tells you | Classic pitfall |
|---|---|---|
| Clicks | How many users clicked from Google to your site | Cross-reference with GA4 / server logs — GSC undercounts bot clicks and some private browsing sessions |
| Impressions | How many times a URL appeared in a SERP served to a user | An impression counts even if the URL was on page 5 — volume alone says nothing about relevance |
| CTR | Clicks ÷ impressions | Comparing your CTR to an “industry” benchmark is pointless. What matters = the CTR of your URL at its position in its SERP |
| Average position | Impression-weighted average position over the time window | This is a smoothed average — a URL stable at position 3 and a URL fluctuating between 1 and 6 can show the same number. Never read position alone; always cross-reference with impressions + CTR |
The practical rule: never read a metric in isolation. A position improving without clicks following = a signal you’re ranking on low-volume queries. Impressions rising with CTR falling = either a title that needs work, or a SERP transformed by a Google feature (AI Overview, Featured Snippet, People Also Ask).
💡 Want to see these 4 metrics over 24+ months instead of the 16 Google imposes? Sauvegarder mon historique GSC →
Method: the Google Search Console workflow in 4 steps
Knowing the interface isn’t enough. The difference between a team that steers its SEO from Google Search Console and one that drowns in it comes down to one thing: a repeatable workflow. Here’s the one we see at sites that genuinely extract value from the tool.
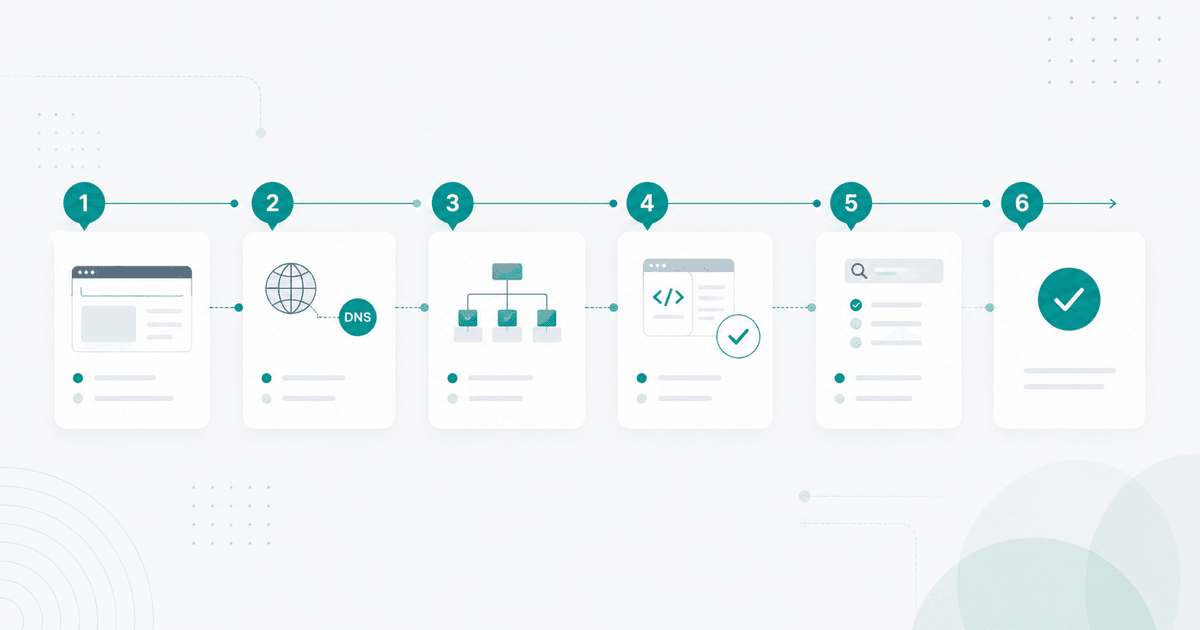
Step 1 — Clean setup (do it once, verify every quarter)
Before any analysis, make sure GSC is seeing the right thing. Three structural decisions:
- “Domain” property rather than “URL prefix”, unless there’s a specific technical reason. The domain property covers all variants (HTTP/HTTPS, www/apex, subdomains), so no risk of looking at half your traffic and thinking you’re seeing everything. Configuration via DNS verification (TXT record), 5 minutes.
- Sitemap declared, up to date, and clean. A sitemap containing 404 URLs, redirected URLs, or non-canonical URLs pollutes the indexation report and wastes Google’s crawl budget on useless URLs. Verify that the submitted sitemap is exactly the list of URLs you want indexed — nothing more.
- URL parameters and domain filters consistent. On an e-commerce site with facets, or a SaaS with tracking query strings, make sure the canonicalized URLs are the ones declared in the sitemap. Otherwise, you end up with hundreds of variants in the “Indexed, not submitted in sitemap” report — guaranteed noise.
Step 2 — Weekly read (15 minutes, Monday morning)
A good GSC cadence is weekly, not monthly. At 28 days, you see cumulative variations and miss inflection points; at 7 days, you catch shifts as soon as they happen. The ritual:
- Compare 7 days vs. the previous 7 days in the Performance tab. Read the 4 metrics globally, then filter in “Compare” mode to see the raw delta for each query and each page.
- Segment branded vs. non-branded. Branded losses often come from a SERP change (reworked sitelinks) or seasonality; non-branded losses are almost always actionable (dated content, a competitor moving ahead, a botched title rewrite). Without this segmentation, you’re mixing two signals.
- Spot the 5–10 biggest variations in absolute value (not percentage — a -50% on 4 clicks means nothing). Pages and queries combined.
Step 3 — Drill-down by detected signal
For each signal spotted in step 2, go one level deeper:
- A page is losing clicks? Filter on that URL → see which queries dropped → check whether position moved or whether CTR collapsed. If position is stable but CTR is falling: SERP transformed (AI Overview, a competitor’s snippet, People Also Ask pushing organic down). If position is dropping: URL was reworked, content is dated, or quality signals were lost.
- A query is gaining impressions without clicks? You’re ranking on a neighboring intent, not the query itself. Often an opportunity to create a dedicated page — or to rewrite the title to better match.
- A category of URLs disappears from the indexation report? Pages report → filter “Not indexed” → identify the pattern (Crawled - currently not indexed, Discovered - currently not indexed, Duplicate without user-selected canonical, etc.). Each pattern maps to a concrete action.
Step 4 — Action + tagging
Every SEO action triggered by GSC deserves to be time-stamped: publication date of new content, date of a title rewrite, date of a sitemap fix, etc. Without this record, you’ll never know whether the recovery three weeks later was caused by your action or by Google’s natural cycle. A simple shared spreadsheet (Date | URL | Action | Target metric) is enough to start — the point is discipline, not the tool.
💡 Want to tag your SEO actions directly on the trend curves? Sauvegarder mon historique GSC →
The Google Search Console limitations that force an external workflow
The workflow above holds up on small to medium-sized sites. Beyond a certain volume, Google Search Console shows its three structural limitations — and nobody in the official documentation warns you.
Limitation 1 — The 1,000-row cap
The GSC interface caps at 1,000 rows per query. On a site generating a few hundred thousand impressions per month, that’s nowhere near enough: the long tail (the 80% of queries generating fewer than 10 impressions each) stays invisible, even though that’s precisely where CTR opportunities and underserved content angles hide. You see the tree, not the forest.
Official workaround: the Search Analytics API (free, but requires code) or the BigQuery export (official since 2023, faster but non-trivial initial setup). On the third-party tool side, any serious solution should consume one of these two sources — not the UI.
Limitation 2 — The rolling 16-month history
Google Search Console keeps a maximum of 16 months of data, on a rolling basis. By mid-2026, you can’t cleanly compare to mid-2024. For a seasonal site (e-commerce, travel, retail), that’s a handicap; for understanding the impact of a Core Update from 18 months ago, it’s a dealbreaker; for a long-term trend audit, it forces you to cross-reference with screenshots or internally stored exports — a fragile practice that breaks the moment a team member leaves.
The only clean way to preserve a complete history is to start archiving from day one — either via a daily BigQuery export you maintain yourself, or via a tool that does it for you.
Limitation 3 — No delta sorting in the UI
GSC’s comparison view does display two periods side by side, but sorting remains limited. You can sort by absolute clicks in the current period, but not by absolute variation or relative variation sorted descending across all 1,000 rows. The result: to identify the 10 pages that dropped the most, you have to export to CSV, open Excel or Google Sheets, write a delta formula, and re-sort — every single week.
This is the most underestimated of the three limitations, because it’s invisible: you don’t know what you’re missing. A page dropping from 800 clicks to 500 clicks is urgent; in the GSC UI, it gets buried in a table sorted by volume.
These three limitations are why the majority of mature SEO teams end up building — or subscribing to — an analytics layer on top of Google Search Console. Not to replace the tool, but to fully exploit the data it delivers.
The GSC reports most people ignore (and why they’re worth 30 minutes a month)
The Performance tab captures 80% of attention. But four less prominent reports do something nothing else does, and they’re typically only opened once a problem is already advanced. Reviewing them monthly takes thirty minutes and prevents several categories of incidents.
Manual Actions. This is the report to open before anything else the day a site suddenly loses traffic. A Manual Action is a penalty applied by hand by a Google quality rater: spammy content, misleading schema, artificial links, massive duplication. If a sanction has been applied, GSC displays it here with an explicit label — otherwise, this report is empty, and you can rule out that hypothesis and move on to other causes (Core Update, technical overhaul, etc.). The scenario to avoid: spending two weeks hunting for the cause of a 60% traffic drop without checking this report first.
Links. The Links report (internal and external) doesn’t replace Ahrefs or Majestic — Google only delivers a subset. But it serves two specific purposes: spotting an orphan page (an important URL receiving 0 internal links, meaning it’s not discoverable through navigation) and identifying top external referrers, useful for PR work or for detecting an abnormal spike in backlinks (a signal of a potential negative SEO attempt).
URL Removals. An operational tool for temporarily removing a URL from SERPs within 24–48 hours (for example: a profile page for an employee who just left the company, sensitive legal content). Don’t confuse this with a permanent noindex: the GSC removal is valid for 6 months, buying time to implement a permanent solution.
Crawl Stats. Accessible via Settings → Crawl Stats. Displays the daily crawl rate, median HTTP status, and the share of pages crawled vs. re-crawled. Used to diagnose anomalies: a spike in 5xx errors during a deployment, a drop in crawl rate after a botched migration, over-crawling of useless facet URLs. Essential on sites with more than 100,000 URLs; unnecessary below that threshold.
GSC vs. Bing Webmaster Tools — should you use both?
Bing’s market share in the US hovers around 6–8% and has been relatively stable. It’s marginal, but it’s not zero — and Bing Webmaster Tools gives access to several things GSC doesn’t deliver: keyword search volume (whereas GSC only shows queries you already rank for), an automated SEO report that detects on-page issues, and a more permissive URL inspection tool. And since 2024, Bing powers a portion of results in ChatGPT, Copilot, and Perplexity — which changes the stakes around indexation for AI-driven search engines.
Our practical recommendation: submit your site to Bing Webmaster Tools, if only to verify you’re properly indexed there. It’s 10 minutes of configuration. But don’t spend more than an hour a month on analysis — the marginal effort isn’t worth it compared to the Google signal, except in very specific niches (senior B2B IT, medical sectors where Bing is over-represented, audiences heavily using Microsoft products).
What changed in GSC between 2023 and 2026
Three structural developments have changed how to work with GSC over the past three years — and their impact remains under-discussed.
The official BigQuery export (announced late 2023, rolled out broadly in 2024) transformed access to raw data. Rather than scraping the API row by row, any property can now stream its data into BigQuery daily, with unlimited history (provided you start storing from the day of activation). For sites above 50,000 URLs, this has become the standard — and it’s what finally makes analysis beyond GSC’s 16-month window possible, without workarounds.
Insights (a tab that was deprecated then relaunched in a new form in 2024) attempts to automatically detect opportunities and anomalies. In practice, they remain hard to act on for large sites (signal lost in volume) but can be useful on small, single-language sites. Worth a glance; not worth steering by.
The impact of AI Overviews and SGE on GSC metrics is gradual and hard to isolate. What we observe is a progressive CTR degradation on certain high-volume informational queries, without any position movement. The practical benchmark: if an informational URL loses 25% CTR over 6 months on its primary queries without a position drop, the “AI Overview eating the click” hypothesis should now be considered first — before suspecting a title or content issue.
Frequently asked questions
How long does Google take to index a new URL via GSC? Between 2 days and 4 weeks, depending on the site’s authority and sitemap quality. Forcing indexation via URL Inspection → Request Indexing helps marginally — the gap between a request and natural indexation is generally a matter of days, not weeks.
Should you declare multiple sitemaps or just one? Multiple, split by content type (articles, categories, product pages) and capped at 50,000 URLs per sitemap. This lets you pinpoint which segment has an indexation problem — a “articles” sitemap with 95% of URLs indexed and a “product pages” sitemap at 60% immediately points you to the area to investigate.
Does GSC systematically undercount clicks compared to GA4? Yes, typically by 10–30%, because GSC ignores non-Google sessions and some private browsing windows. The right benchmark: track trends (GSC clicks rise when GA4 organic sessions rise), not absolute values.
Conclusion: making GSC a steering tool, not a one-off audit tool
Google Search Console is, and remains, the organic source of truth: no third-party solution sees what Google sees from deep inside its index. But its surface — an interface capped at 1,000 rows, 16-month history, limited sorting — hasn’t evolved at the pace of the sites it’s supposed to monitor.
The real question isn’t “GSC vs. other tools.” It’s how to turn the monthly read into continuous steering. That requires three things: a cadence (weekly, not monthly), a method (branded/non-branded segmentation, signal-based drill-down, action tagging), and an analytics layer that goes beyond native limitations as the site grows.
Without these three ingredients, GSC stays a one-off audit tool — useful, but underexploited. With them, it becomes what it was always designed to be: the daily compass for data-driven SEO.
Essayez sur ce cas d'usage
Conservez votre historique GSC au-delà des 16 mois
Google Search Console efface vos données passées 16 mois. SearchLens archive votre historique complet en continu, dès l'onboarding.
Sauvegarder mon historique GSC →Essai 7 jours · pas de carte bancaire · annulation en 1 clic.
- Backfill automatique des 16 mois disponibles à la connexion
- Sauvegarde quotidienne de l'ensemble des nouvelles lignes
- Bouton Max sur toutes les courbes (au-delà des 16 mois)
À lire également
How to Analyze Google Search Console Performance: The Complete Guide
Master Google Search Console's Performance report: 4 key metrics explained, weighted average position, quick wins from page 2, and traffic-drop detection before it hits.
Set Up Google Search Console Step by Step: The Complete Guide
Set up Google Search Console step by step: Domain vs URL-prefix property, DNS validation, sitemap submission, and indexation. Key methods and native limits to know before you start.
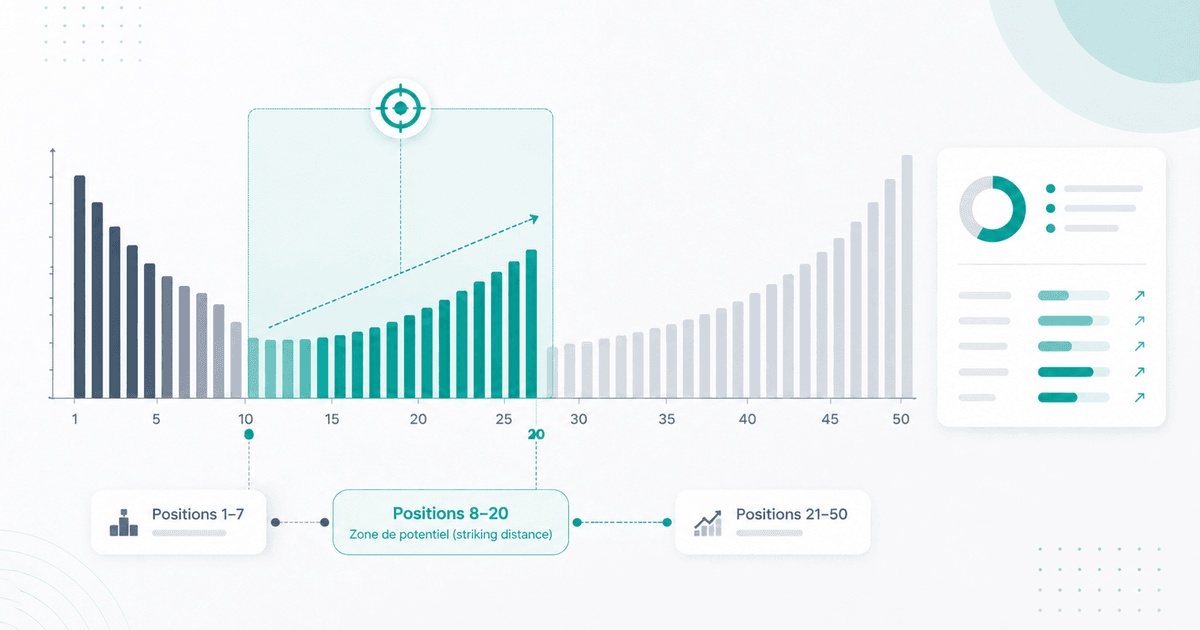
SEO Keyword Optimization: How to Turn Positions 8–20 Into More Clicks
Method to identify striking distance pages (positions 8–20) in GSC, prioritize high-potential URLs, and measure impact without getting misled by seasonality.